This is the second of a two part post about my recent studio remodel and acoustic treatment. Read the first part here.
Once all the acoustic treatment was installed and the furniture was moved back in, I took another series of audio measurements. All my measurements are quasi-scientific, using materials I had on hand: a Max patch to generate test tones, a home-built omni mic, a spreadsheet. I only tested the frequency response for lower frequencies (20 Hz to approximately 350 Hz). I made no attempt to measure the reverberant response of the room (RT60). Given these limitations, the data nonetheless show a clear improvement in frequency response in the room.
Test Results
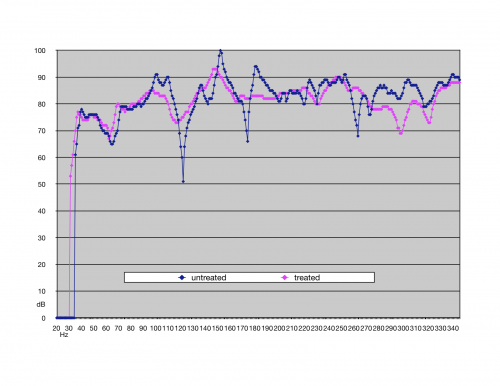
My goal was to flatten the frequency response of the room, knowing that a perfectly flat response isn’t practical given the dimensions of the room (or of my wallet). The chart above shows a range of approximately 50 dB in the untreated room, with the lowest reading of 51 dB at 122 Hz and the highest reading of 100 dB at 151 Hz. After the treatment was installed the range is approximately halved to 26 dB, from 67 dB at 62 Hz to to 93 dB at 148 Hz.
One unanticipated difference between the tests is the difference in low frequency readings. In the untreated room, my sound level meter registered nothing below 35 Hz. Once the room was treated, the meter picked up readings beginning at 31 Hz. This bass extension may be due to my ad hoc test equipment, but I seem to hear it.
Listening tests in the treated room were revelatory. Overall bass response is noticeably more even. Much more striking for me is how much the stereo imaging has improved in the treated room. The soundstage seems more defined and both wider and deeper. I’m shocked by how much improved even older stereo mixes sound in the treated room.
Listening to the Beatles “A Day in the Life” in the untreated room I felt like I heard the hard-panned mix just fine, despite some muddiness and boominess in the toms. In the treated room, the toms are clearer and more even, as expected, but even the hard-panned stereo image is more defined. Many tracks in the untreated room suffered from the “hole in the middle” syndrome, whereas in the treated room the sounds are more evenly distributed. I noted that Miles Davis’ “So What” seemed to have good imaging between the bass and trumpet in the untreated room. Listening to it with the acoustic treatment installed I can hear more than just the separation between the instruments–I can hear the sound of the room the instruments were recorded in.
Not Going Back
Remodeling my studio disrupted my work and schedule, but the results are well worth it. Even though it seems pedestrian to spend time and money on acoustic panels rather than boutique microphone preamps or the fashionable plugin du jour, I’ll continue to choose the former over the latter. I’ll never work in an untreated room again.


